

Strategy is Profitable. But still Lost ₹6.7 Lakh in a year. Here Is Why.
The silent execution costs that turn winning trades into losing ones. And what you can actually do about it.

Most traders spend months building a strategy. They backtest it. They paper trade it. They see the numbers work. Then they go live and something feels off. The profits are smaller than expected. The losses are bigger. There is a gap.
This article is about that gap. It has a name. It has a mechanism. Let us explore.
The Problem That Hides in Plain Sight
Start with a simple trade. You plan to buy an stock/option at ₹100. Your target is ₹105. Your stop loss is ₹98. On paper, this trade gives you a planned profit of +5 on a win and a planned loss of -2 on a stop out.
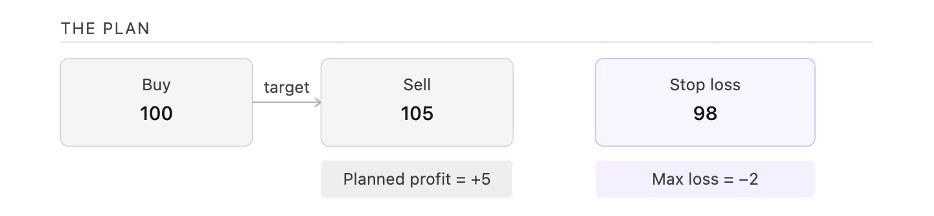
The math works. The strategy has positive expectancy. Run it long enough and you should come out ahead. At 50% win rate, every two trades nets you ₹3 on average.
That is the plan. Here is what actually happens.
Why Good Strategies Bleed
You try to buy at ₹100. Your order gets filled/executed at ₹101. That is ₹1 slippage on entry. The trade goes your way. You try to sell at ₹105. You get ₹104 instead. Another ₹1 slippage on exit. Your planned ₹5 profit becomes ₹3.
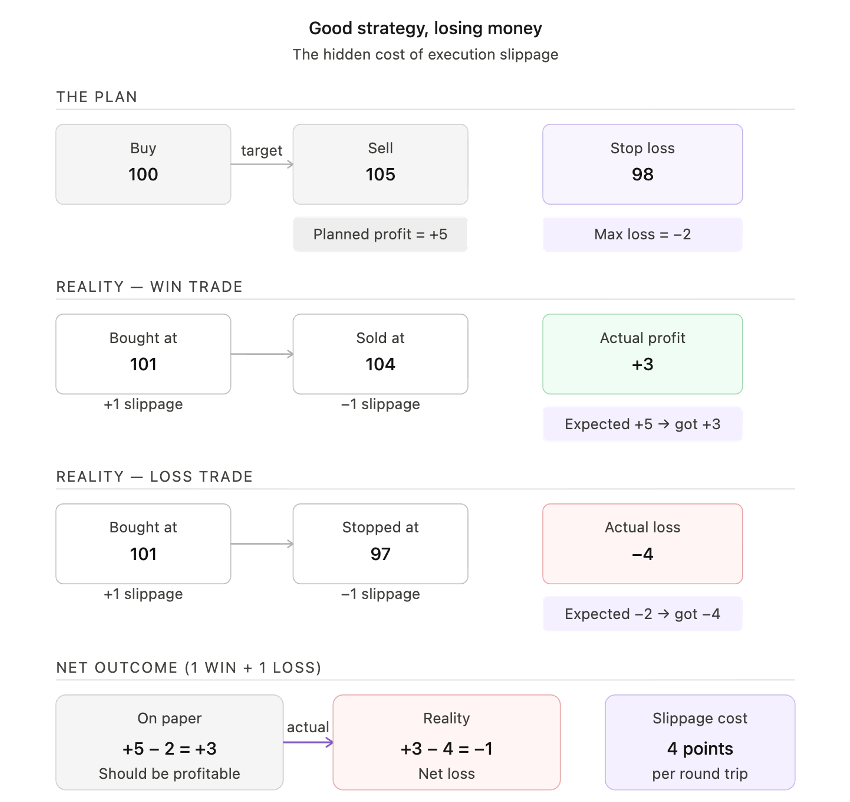
Now take the losing trade. You bought at ₹101 due to entry slippage. Your stop was at ₹98. It triggers. You get ₹97 instead of ₹98. Exit slippage of ₹1. Your planned -₹2 loss becomes -₹4.
Look at one win and one loss together.
On paper: +5 and -2 = net +3.
In reality: +3 and -4 = net -1.
A strategy that looked profitable on paper delivered a net loss in practice. Nothing changed about the setup. Only the execution costs came into play.
This is the P&L gap. And it grows with every trade you take.
What Is Slippage?
Slippage is the difference between the price you expected and the price you actually got.
You open your trading terminal. You see the option trading at ₹136.05. You place a buy order. By the time the order reaches the exchange and gets matched, the price is ₹138. You are already ₹2 behind before the trade has even had a chance to work in your favour.
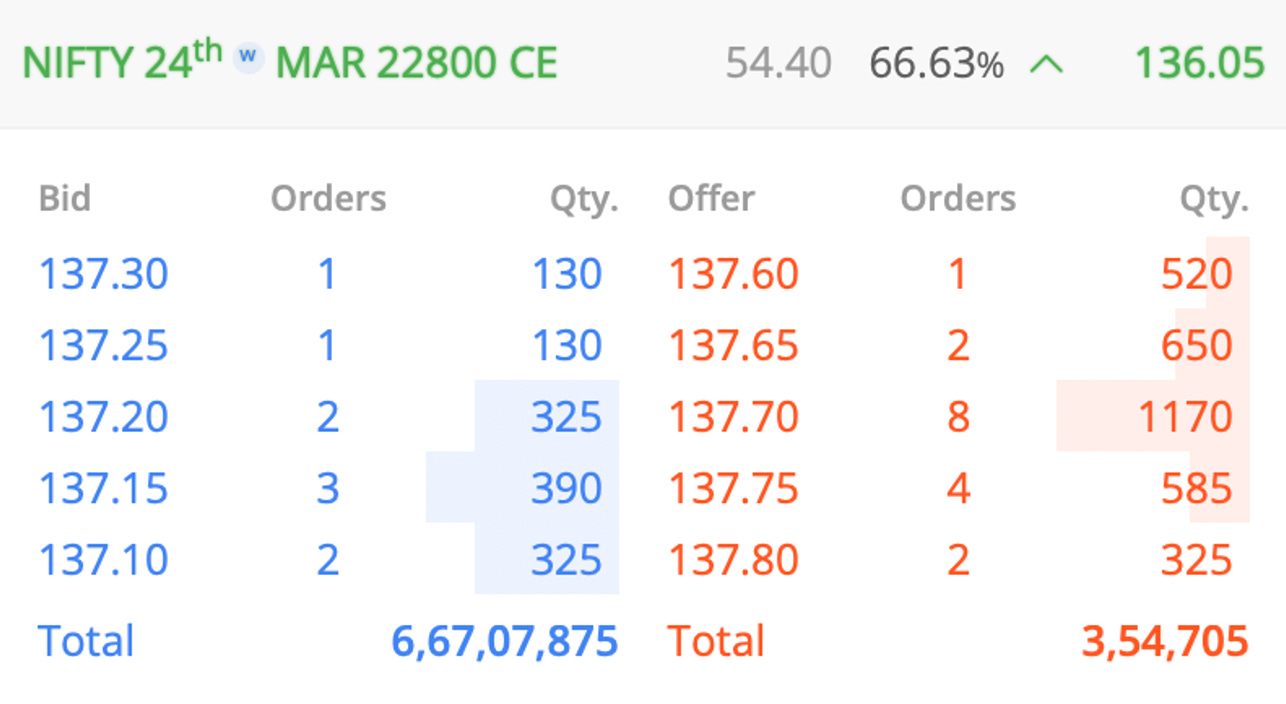
The prices on your screen are already delayed. They are not real-time. The exchange sends data to your broker. The broker displays it on their platform. It travels through your internet connection. By the time you see ₹136.05, that number is already stale.
Why Slippage Happens: The 10 Layers
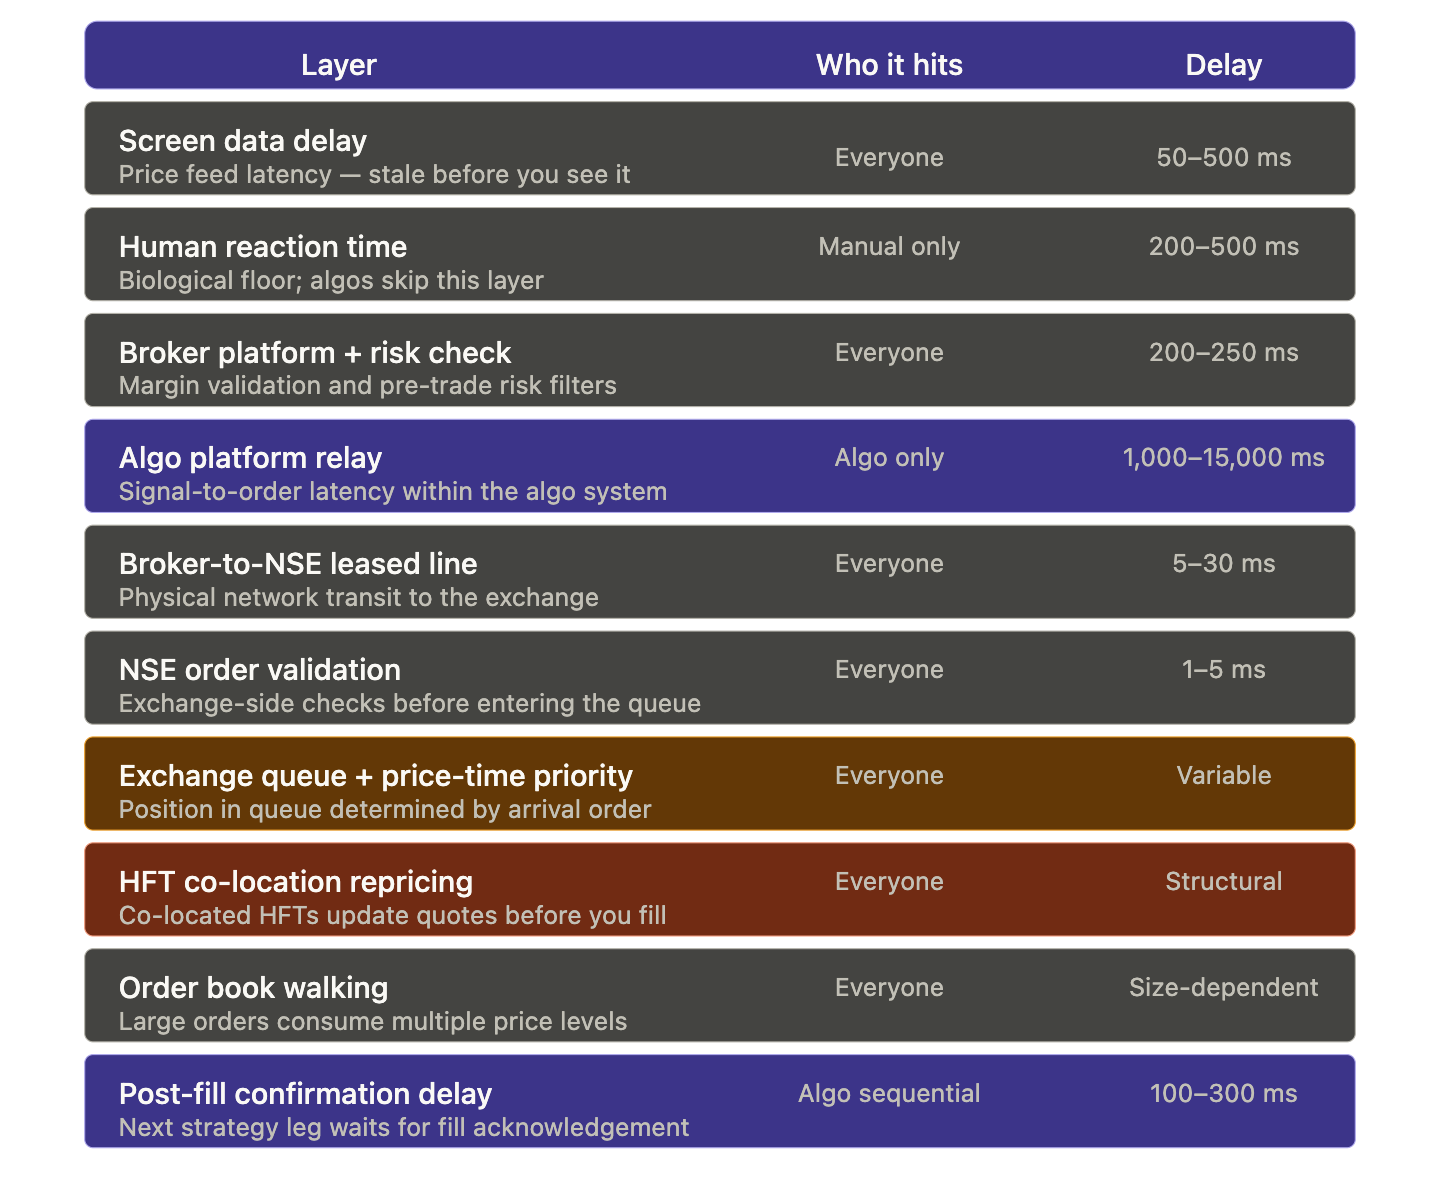
Your order does not go directly from your finger to the exchange. It passes through at least ten distinct layers before it gets filled. Each layer adds delay. Each delay creates a window for the price to move before your order gets executed.
The table below breaks this down layer by layer, including who it affects and how much delay each one introduces.
Let me explain these.
Screen data delay. The prices on your screen are already 50 to 500 milliseconds old. The exchange sends data to your broker, the broker displays it, and it travels through your internet connection. By the time you see a price, it is stale.
Human reaction time. If you are placing orders manually, the time between seeing a price and clicking buy can add another 200 to 500 milliseconds. Algo traders skip this layer entirely.
Broker platform and risk check. Before your order moves anywhere, your broker runs margin checks and pre-trade risk filters. This adds another 200 to 250 milliseconds to every single order.
Algo platform relay. If you use an algo platform, the signal has to travel from the platform to the broker’s API before the order is even placed. The algo platform relay is the one most algo traders underestimate. Depending on the platform and its server load, this layer alone can introduce anywhere from 1,000 to 15,000 milliseconds of delay. That is one full second to fifteen seconds. In a fast-moving market, that is a big delay.
Broker-to-NSE leased line. Once your broker sends the order to the exchange, it travels over a physical leased line. That network transit adds another 5 to 30 milliseconds.
NSE order validation. The exchange runs its own checks on your order before allowing it into the queue. Another 1 to 5 milliseconds gone.
Exchange queue and price-time priority. Your order enters a queue. NSE gives priority first to the best price, then to orders that arrived earliest at that price. Where your order lands in that queue is completely random from your perspective. This is why slippage cannot be predicted in advance.
HFT co-location repricing. High frequency trading firms are located inside the exchange. They can see buying aggression in the order flow and raise their offer prices before your order is matched. By the time your order fills, the price has already moved against you. This one is structural and unavoidable for retail traders.
Order book walking. If you want to buy 1,000 Quantity but only 520 are available at the best price, you get those 520 at one price and the rest at the next level. The larger your order, the worse this gets.
Post-fill confirmation delay. After your order executes, the exchange sends confirmation back to your broker, and your broker sends it back to you. If your strategy places a second order only after the first one confirms, this 100 to 300 millisecond delay directly affects the execution of the next leg.
The Numbers That Should Make You Stop
We have a cost simulator on our website. These are numbers from a real example. I will take you through it. You can access it here.

Inputs on the left hand side:
₹5 lakh capital,
20 trades per day,
100% profitable days,
1:1 risk-to-reward,
₹100 average premium,
200 quantity,
bid-ask spread of 0.25%,
slippage of 0.5%.
Result on the right hand side of the pic above:
Gross profit for the year: ₹12,50,000. This is the profit before any costs.
The strategy wins on all 250 trading days.
Total costs = ₹19,23,087.
brokerage and other statutory charges ₹4,23,087,
bid-ask spread cost ₹5,00,000,
slippage cost ₹10,00,000.
Net Profit = a loss of ₹6,73,087. On a capital of ₹5 lakh. That is capital wiped out.
A strategy with 100% profitable days, no losing trades at all, still ends the year deep in the red. The only reason is execution costs. This is what active intraday trading with high trade frequency looks like when you account for the real cost structure.
How to Reduce Slippage
Here is what you can actually control.
Cap intraday trades at 6 per day (12 main orders). Every trade is two orders: one to enter, one to exit. 12 orders per day is the ceiling. Beyond that, the cumulative slippage on all those fills starts to overwhelm whatever edge the strategy has. In practice, most strategies that take more than 12 orders per day end up net negative after accounting for execution costs.
Completely avoid scalping and high frequency trading. At very short timeframes, the slippage and bid-ask spread as a percentage of the trade's potential profit are simply too high. A strategy might look profitable at the gross level, meaning before costs. But once you apply realistic bid-ask spread percentages and slippage, the net result is a loss. This is not a recoverable situation by tweaking the entry or exit. The entire approach needs to change.
Avoid low premium options. Low-premium options have a wide spread relative to their price. On a ₹20 option, a ₹0.50 bid-ask spread is already 2.5% of the premium. Add slippage on top and the cost of entering and exiting can easily reach 4 to 5% per round trip. The probability of a trade being profitable has to overcome that cost hurdle before any profit starts.
Track every fill. Expected price versus actual price. This is the discipline most traders skip. If you do not track your fill quality, you have no idea where your money is going. Tracking this data shows you whether your execution is getting better or worse, whether a particular algo platform is adding unnecessary delay, and whether certain times of day produce worse fills. It is the only way to understand and improve your actual execution quality over time.
Don’t Donate Money
If you have low capital, say ₹1 to 2 lakhs, and you are trying to scalp or take 40 to 50 trades a day, that combination is particularly dangerous. The math does not work even with a good strategy. The execution costs will consistently outpace any edge the strategy carries.
The market has sophisticated participants on the other side. HFTs sitting inside the exchange. Market makers who earn the spread every time.
If you trade excessively with low capital, you are basically donating money to brokers, exchange HFTs, market makers, and other stakeholders.
The only sustainable path for a retail trader is fewer, better trades, with larger premiums, and a clear understanding of what execution actually costs.
Understanding slippage is crucial. It is the difference between a strategy that survives and one that quietly bleeds your account.
That’s it for today.
I have covered the topic in more detail in the video below. If you prefer watching, do check it out.
FINVEZTO.COM | Build Wealth. With Clarity.
We give you a Flexi-Wealth System and In-Depth Research to build a Life-Long Portfolio that works across market cycles.
Disclaimer: Anand Ganapathy K is a SEBI-registered Research Analyst with SEBI registration number INH000016630. This post is purely for learning purposes. I do not recommend buying or selling stocks mentioned in this newsletter. I do not hold any positions in the stock discussed. Securities market investments carry market risks. Kindly review all related documents before investing.
Hi sir, it's been some time to see you in YouTube. can we expect any video in the finvezto channel?