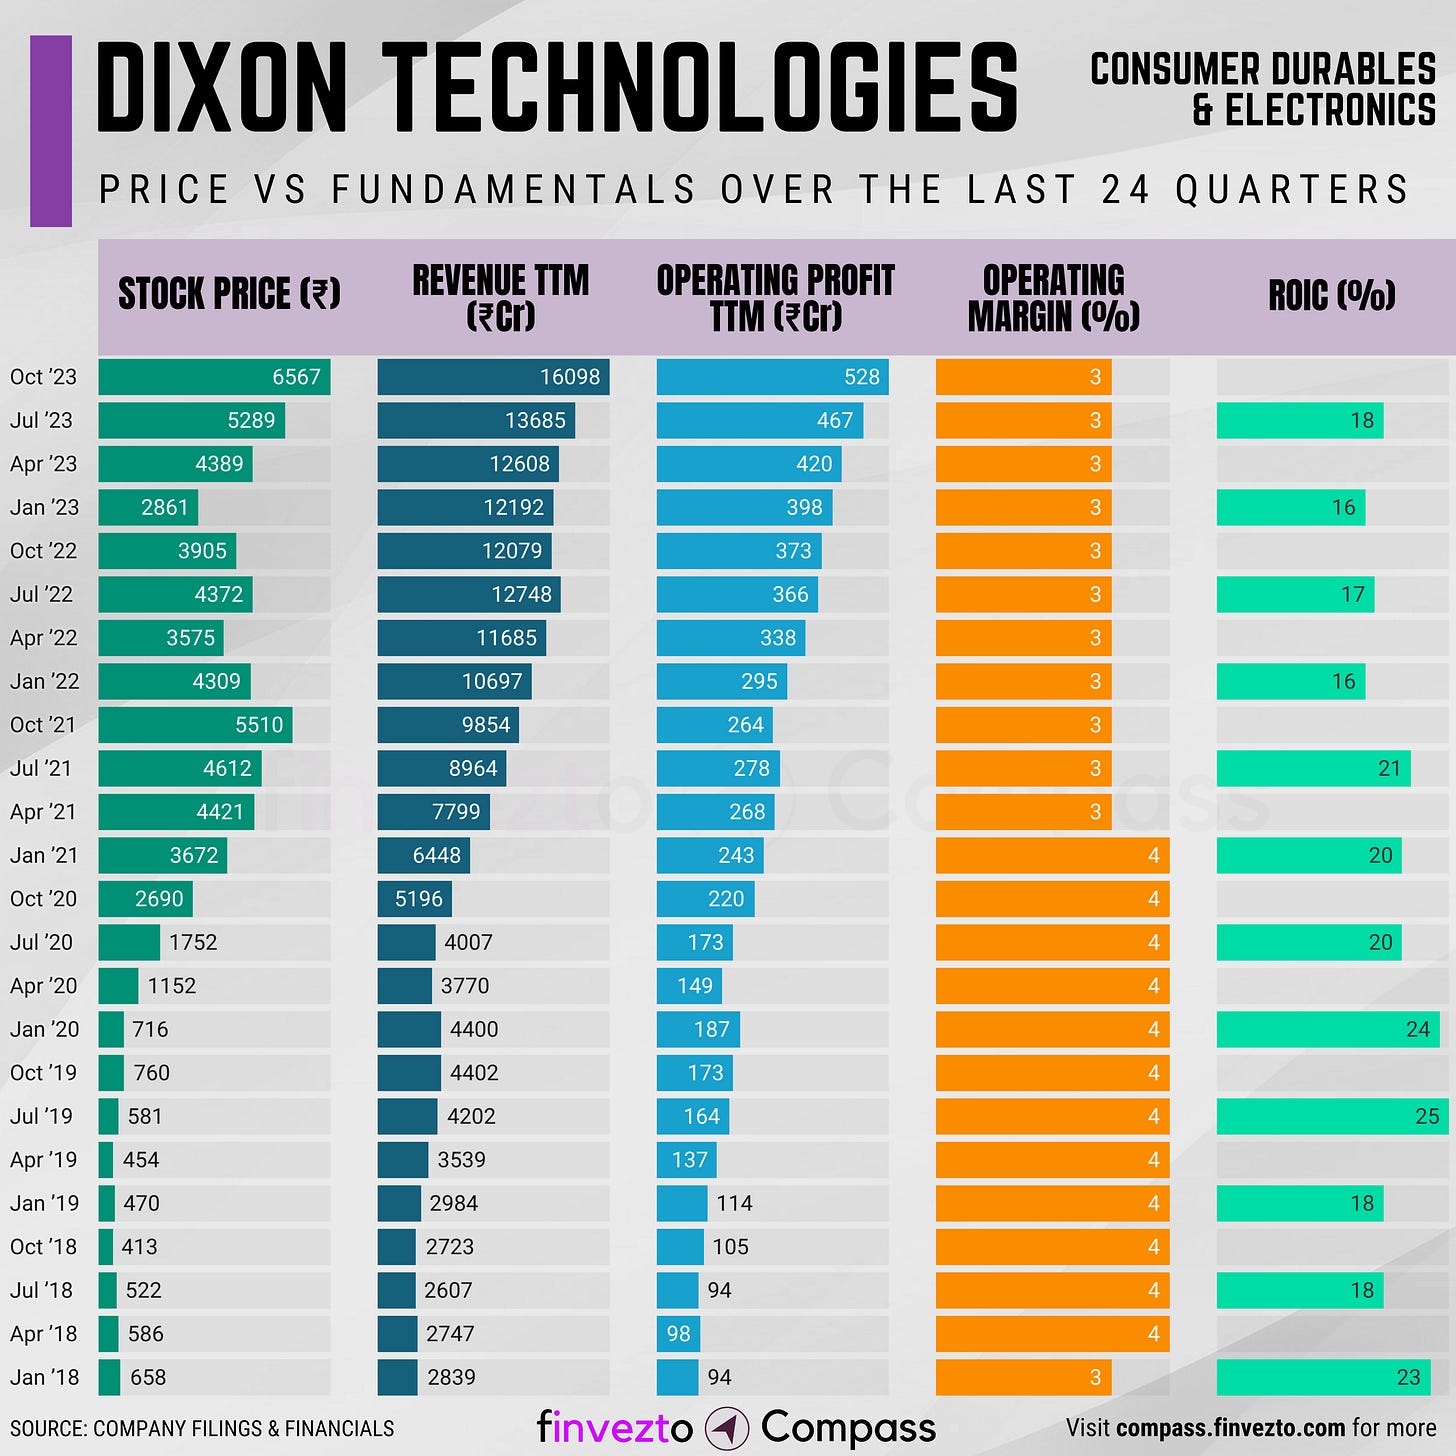
DIXON TECHNOLOGIES - Consistently Performing Businesses Series
Price vs Fundamentals over the last 24 Quarters
In this series of consistently performing businesses, we will look at the key fundamentals of DIXON TECHNOLOGIES and how it has changed over the last 24 Quarters.
Company Overview
Diversified Operations: Established in 1993 by Sunil Vachani, DIXON Technologies is a diversified Electronic Manufacturing Services (EMS) company. It operates across various electronic products verticals including consumer electronics, lighting, home appliances, CCTV cameras, mobile phones, and also engages in reverse logistics operations.
Manufacturing and Joint Ventures: The company manufactures security surveillance equipment, wearables, and hearables, as well as AC-PCBs. It has recently entered a joint venture with Imagine Marketing Private Limited to design and manufacture wireless audio solutions in India.
Extensive Manufacturing Footprint: Headquartered in Gurgaon, DTIL boasts around 21 manufacturing facilities located in Noida (Uttar Pradesh), Dehradun (Uttarakhand), Ludhiana (Punjab), and Chittoor (Andhra Pradesh), reflecting its significant manufacturing capacity.
PLI Scheme Approvals: In recent years, DTIL and its subsidiaries/JVs have received approvals under the production-linked incentive (PLI) scheme for five segments: mobile phones, lighting, telecom and networking products, inverter controller boards for air conditioners, and IT hardware.
Product Expansion: Recent ventures into new product categories, such as refrigerators and commercial displays, signal growth opportunities.
Strong Clientele: DTIL services reputed global brands, ensuring stable business inflows and showcasing its industry credibility.
Revenue TTM: 5.7X Increase
Operating Profit TTM: 5.6X Increase
Stock Price: 10X Increase
Key Fundamental Statistics include:
Revenue TTM: It stands for "Revenue Trailing Twelve Months." It's a metric used to analyse a company's performance by calculating the total revenue generated over the preceding twelve months. We use it to remove any quarterly/semi-annual seasonalities associated with the business.
Operating Profit TTM: It is the sum of operating profit generated over the previous 12 months.
Operating Margin (OPM)% = Operating Profit/Revenue expressed as %
ROIC%: ROIC stands for "Return on Invested Capital”. ROIC indicates how well a company is utilising its Capital to generate profits.
ROIC = Net Operating Profit After Tax (NOPAT) / Invested Capital
If a company can grow its Revenues and Profits maintaining its Margin and Return on Capital, the Stock Price will eventually follow.
"Over the long term, it's hard for a stock to earn a much better return than the business which underlies it earns." - Charlie Munger
"The best companies tend to increase their earnings over time, and the stock prices eventually follow." - William J. O'Neil
"I think you have to learn that there's a company behind every stock and that there's only one real reason why stocks go up. Companies go from doing poorly to doing well or small companies grow to large companies."- Peter Lynch
Points to Remember
There are 2 parts to Fundamental Analysis. How the company has executed in the Past and how well it is placed for the Future. When we look at the data points as presented in the chart above, we mostly see the past and recent performances. It is like a rear-view mirror. It is not indicative of future performance.
One needs to keep track of the company’s performance periodically and keep updating the above chart.
We will be adding the list of consistently performing businesses periodically in Finvezto Compass.
FINVEZTO.COM | Useful & Actionable Stock Market Tools


